How to Use Hamro Trading Journal to Record Your Trades and Improve Your Performance
Last updated
Trading without a journal is like driving without a rearview mirror. You can move forward, but you have no idea what you’re leaving behind or what patterns are catching up to you. Hamro Trading Journal is a comprehensive tool designed to help forex and crypto traders track every trade, analyze their performance, and make smarter decisions over time. Here’s how to make the most of it.
Trading Journal Tab – Click here
Getting Started
When you visit the page where Hamro Trading Journal is hosted, you’ll be prompted to log in if you haven’t already. Once inside, the journal is completely private your trades are stored under your personal account, and no other user can see them.
After logging in, you’ll land on the main journal interface. The layout is organized around a clean vertical tab navigation that includes Add Trade, Performance, Zella Score, Monthly Analytics, Analytics, Calendar, and Trade History. You’ll spend most of your early time on Add Trade, but the real growth happens when you start exploring the other tabs regularly.
Recording a Trade
Every time you complete a trade whether it hit your take profit or your stop loss you should record it immediately while the details are fresh in your mind. Delaying this step is one of the most common mistakes traders make, because memory fades fast and so does honest self-reflection.
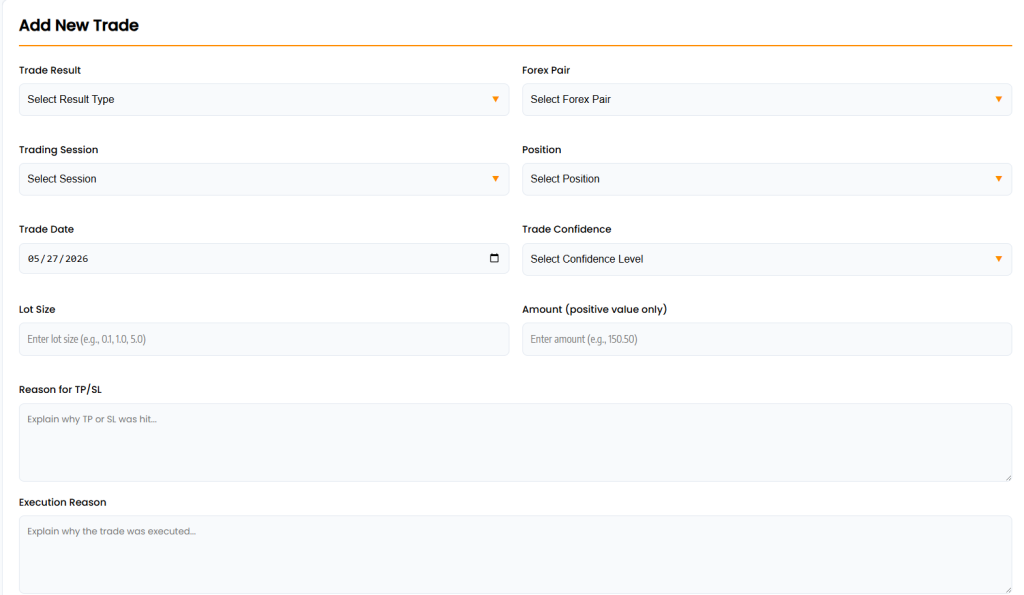
To add a trade, click the Add Trade tab. You’ll find a structured form that captures everything meaningful about the trade.
Trade Result is the first thing you fill in. You choose between TP (Take Profit) and SL (Stop Loss). This binary choice forces you to be honest about the outcome from the start.
Forex Pair lets you select the instrument you traded, from major pairs like EUR/USD and GBP/USD to commodities like Gold and Silver, indices like US30 and US100, and even crypto pairs like BTC/USD and ETH/USD. Futures traders also have an option available.
Trading Session is often overlooked by beginners but is one of the most powerful data points you can capture. You select whether the trade took place during the Asian, London, or New York session, or during one of the overlap windows. This data feeds directly into session performance analytics later on.
Position asks whether you went Long (Buy) or Short (Sell). Tracking this separately helps you discover whether you consistently perform better on one side of the market.
Trade Date defaults to today but can be adjusted if you’re logging a past trade.
Trade Confidence is graded A, B, or C. An A-grade means you had a strong, well-defined setup with high conviction. B means a decent but not exceptional setup. C means you took the trade despite not feeling fully convinced. This is one of the most important fields in the entire journal because it creates a direct accountability link between your conviction and your actual results.
Lot Size and Amount are numerical fields. The amount should always be entered as a positive number regardless of whether the trade was a win or a loss. The system handles the direction automatically based on whether you marked it TP or SL.
Reason for TP/SL is a free-text field where you explain why the trade reached its outcome. Was it a clean market structure break? Did price reverse at a key level? Did news spike the market against you? This field is where your journal becomes a teacher. Write honestly, even when the outcome was your own fault.
Execution Reason asks you to explain why you entered the trade in the first place. What was the signal? What gave you the conviction to place it? Over time, reviewing these explanations helps you identify which setups genuinely work and which ones you’re taking out of habit or boredom.
TradingView Screenshot Link is optional but highly recommended. Paste a link to your chart at the time of entry or exit. Having a visual record of the setup is invaluable when reviewing your history weeks or months later.
Once everything is filled in, click Save Trade. The journal stores everything securely on the server, so there’s no risk of losing your data if you close the browser.
Reviewing Your Trade History
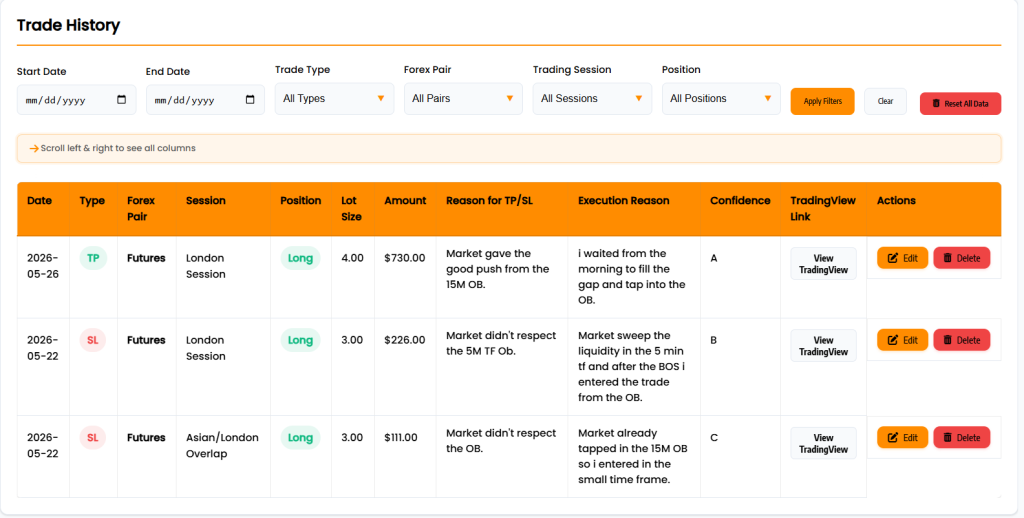
After saving a few trades, head to the Trade History tab. Here you’ll find a paginated table of all your recorded trades with full details in each column. You can filter by date range, trade type, forex pair, session, and position to narrow down specific periods or setups.
If you spot a mistake in a recorded trade, the Edit button opens a detailed modal where you can update every field. You can also delete individual trades if something was entered incorrectly. The Reset All Data button wipes everything clean if you ever want a fresh start but use it carefully as the action cannot be undone.
Understanding Your Performance
Once you have at least a handful of trades recorded, the Performance tab becomes your regular review destination. It shows your total profit, total loss, net P/L, and win rate at a glance. Below those headline numbers you’ll find TP and SL trade counts, total trades, and average profit per trade.
The most instructive section here is Performance by Position, which breaks down your results for long and short trades separately. Many traders discover at this point that they’re significantly better in one direction than the other. If your Long win rate is 65% but your short win rate is 38%, that’s an immediate action item worth investigating before placing another short trade.
Using the Calendar View
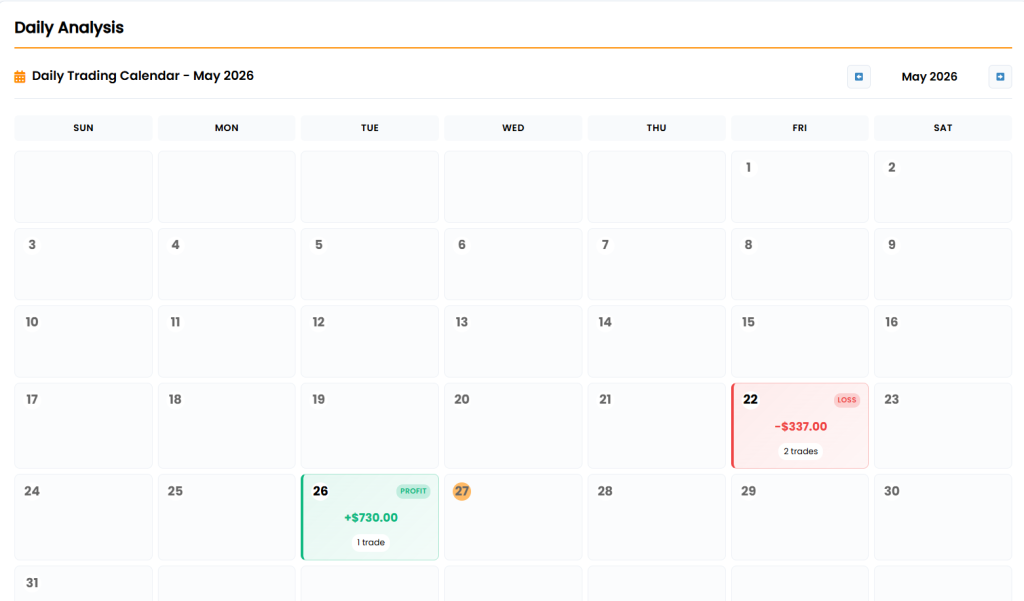
The Calendar tab gives you a month-by-month visual overview of your trading activity. Each day of the month is displayed as a cell. Profitable days appear in green, losing days in red, and breakeven days in orange. Days with no trades are left neutral.
Hovering over any active day reveals a mini breakdown showing the trades taken that day, including pair, direction, and amount. At the bottom of the calendar, a monthly summary shows your net P/L, total trades, number of trading days, and average profit per day.
Use the navigation arrows to move between months. This view becomes particularly revealing when you notice clusters of red days. Are your losses concentrated on certain days of the week? Do you struggle in the final week of the month when you may be chasing targets? The calendar makes patterns visible that are impossible to spot inside a trade log.
The Zella Score
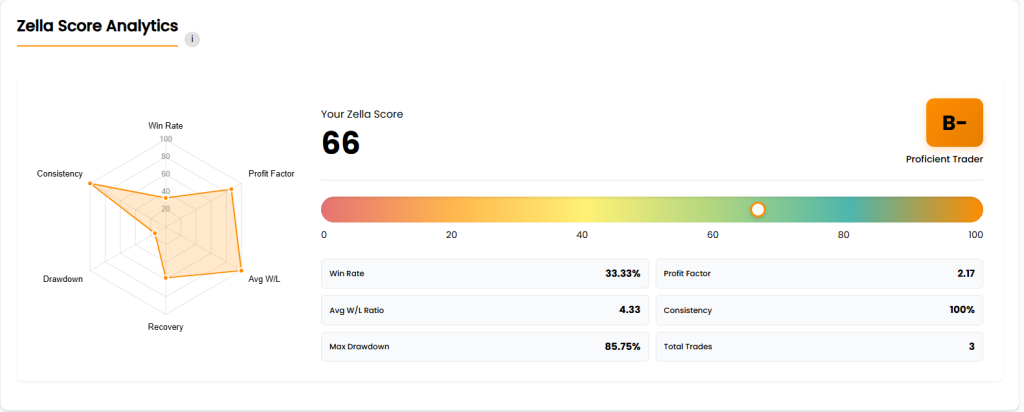
The Zella Score is the journal’s composite performance rating, calculated from six weighted metrics: win rate, profit factor, average win/loss ratio, consistency on high-confidence trades, maximum drawdown, and recovery factor. The score runs from 0 to 100 and is displayed alongside a letter grade ranging from F up to A+.
The radar chart that accompanies the score gives you a visual breakdown of where you’re strong and where you’re falling short. A trader who sees a lopsided radar strong win rate, but very low consistency knows immediately that their A-grade setups are underperforming, which is usually a sign of overconfidence or poor entry execution on the trades they feel most certain about.
The Zella Score is not something to check every single day. Think of it as a medium-term health indicator. Review it weekly, watch whether it trends up or down over time, and let the breakdown guide where you put your improvement energy. If profit factor is your weakest point, focus on either cutting losers faster or extending your winners. If drawdown is dragging the score down, position sizing is the issue that needs addressing.
Monthly Analytics
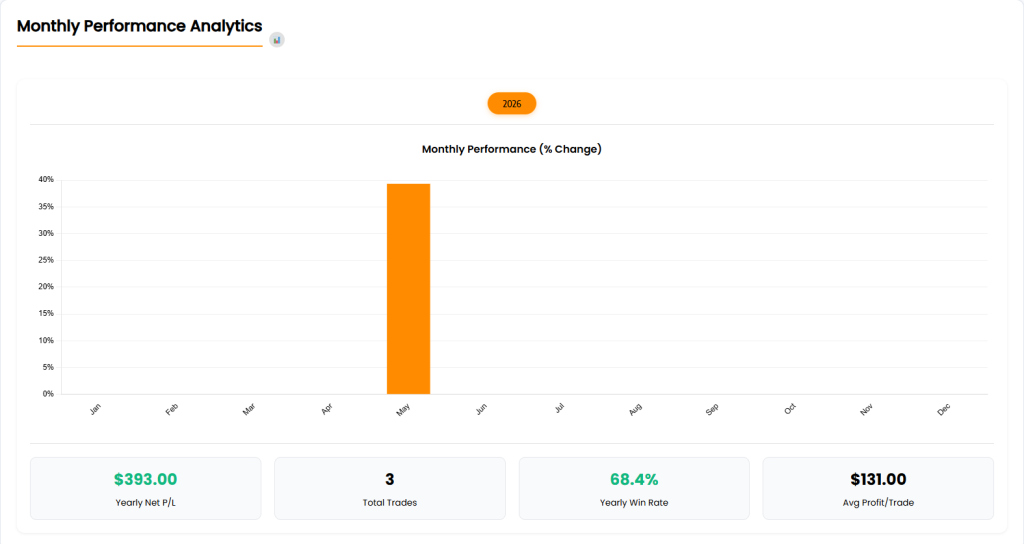
The Monthly Analytics tab lets you view your performance broken down by calendar month across every year you’ve been trading. A bar chart shows the percentage change for each month, color-coded by magnitude. Strong months stand out clearly, and poor months are just as visible.
Below the chart, four summary statistics show your yearly net P/L, total trades, win rate, and average profit per trade for the selected year. You can switch between years using the buttons at the top.
This view is most useful for identifying seasonal patterns. Some traders perform better early in the year when institutional activity is high. Others struggle during summer months when liquidity drops. If you’ve been trading for more than a year, comparing the same months across different years reveals whether your progress is real or simply a reflection of favorable market conditions at the time.
The Analytics Charts
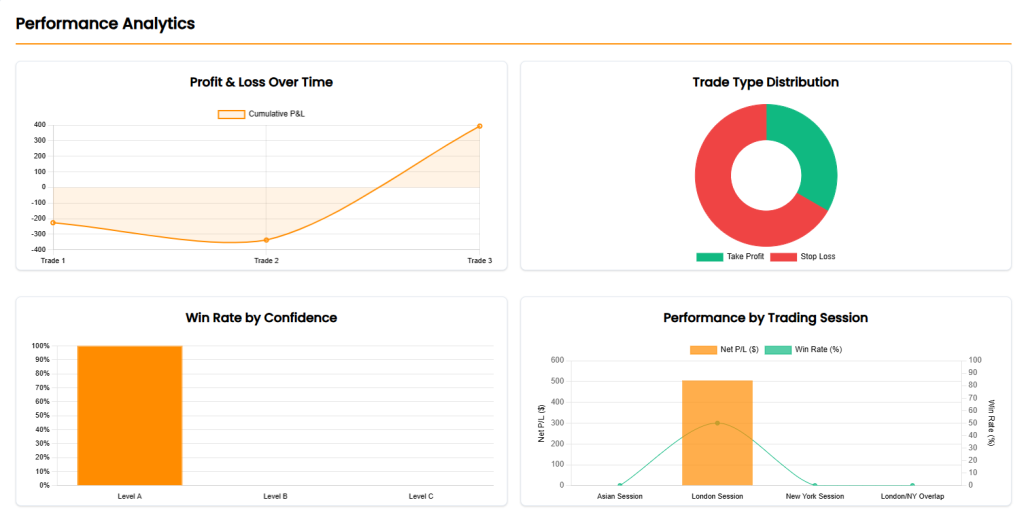
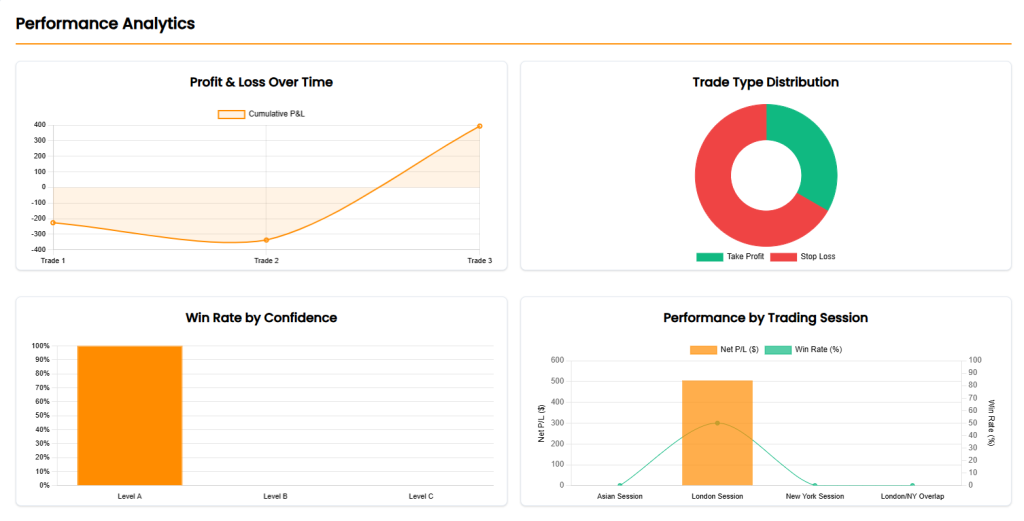
The Analytics tab contains six charts that help you drill deeper into your data. The Profit and Loss Over Time chart shows your cumulative P/L as a line a steadily rising line is what you’re working toward, while a jagged line with deep dips signals inconsistency that needs addressing. The Trade Type Distribution chart shows the visual split between TP and SL outcomes. Win Rate by Confidence is one of the most important charts available, breaking down how your A, B, and C grade trades actually perform compared to each other. Performance by Trading Session combines net P/L and win rate for each session in a single view. Top Forex Pairs Performance ranks your instruments by profitability, and the Lot Size versus P/L scatter plot helps you spot whether larger positions are genuinely helping your results or quietly hurting them.
ML Insights – Your AI Trading Coach
This is where Hamro Trading Journal goes beyond a simple record-keeping tool. The ML Insights tab, powered by the Complete Suite addon, runs advanced machine learning models against your personal trade history to surface insights that would take hours to calculate manually. You need at least five trades recorded before this section activates, and the more trades you have, the more accurate and meaningful the analysis becomes.
Bayesian Win Prediction calculates your posterior probability of winning your next trade based on multiple evidence factors including the session you’re trading, the pair you’ve chosen, your confidence grade, your position direction, the day of the week, and your recent momentum. Each factor is shown with its individual impact on the final probability, so you can see exactly what is helping or hurting your predicted edge before you even enter a trade.
EWMA Risk Model uses exponentially weighted moving averages to calculate a set of professional-grade risk metrics including Sharpe ratio, Sortino ratio, Calmar ratio, Kelly Criterion, CVaR at 95%, maximum drawdown, and current rolling drawdown. These aren’t numbers to memorize they’re warning signals. If your Kelly Criterion turns negative, the model flags it immediately because a negative Kelly means your expected edge does not cover your expected losses, and continuing to trade at your current approach is mathematically destructive.
Holt-Winters Forecast applies a double exponential smoothing model to your monthly P/L history and projects your expected profit or loss for the coming month, complete with a 95% confidence interval. The chart overlays your actual monthly performance, the fitted Holt-Winters line, and the forward projection so you can see where the model expects your performance to go based on current trends.
Isolation Forest Anomaly Detection scans every trade you’ve recorded and flags those that fall outside normal ranges across multiple dimensions simultaneously amount size, lot size, time gap since your previous trade, and confidence-outcome alignment. When a high-confidence A-grade trade hits stop loss, that registers as an anomaly worth investigating. When you suddenly trade a much larger lot than usual, that gets flagged too. These anomalies often reveal moments of emotional trading, overconfidence, or external distraction that you may not have noticed in the moment.
Behavioral Analysis is one of the most confronting but valuable sections. It measures revenge trading by detecting whether your lot size increases significantly after a stop loss, which is a classic sign of emotional decision-making. It checks for overconfidence by comparing the win rates of your A, B, and C grade trades if your C-grade trades are outperforming your A-grade trades, your confidence calibration is broken. It identifies pair fatigue by tracking whether your win rate on specific pairs has been declining over time. And it calculates a composite Decision Quality score from 0 to 100 based on all these behavioral dimensions combined.
Smart Coaching synthesizes everything the models have found and converts it into a prioritized list of personalized action items. Each tip is labeled by impact level critical, high, medium, or informational and explains not just what the problem is but what specific change you should make. If the New York session consistently underperforms for you, the coaching engine will tell you to avoid it or investigate why. If your worst-performing pair is dragging down your overall results, it will name the pair and recommend dropping it from your watchlist.
The full ML analysis also includes a Session-Pair Heatmap that shows your win rate for every combination of trading session and forex pair in a single chart, and a Daily P/L Volatility chart showing your day-by-day performance history as a bar chart. Use the Refresh button at the top of the ML Insights tab to recompute everything after adding new trades.
Trader Notes
The Trader Notes tab gives you a personal space to document your trading thoughts, strategies, observations, and rules. Unlike the structured trade form, notes are freeform you can write anything from a reflection on a difficult trading week to a reminder about a setup pattern you want to focus on.
To create a note, type a title, write your content in the text area, and click Save Note. All your notes appear below the form as cards that can be edited or deleted at any time. This section works well as a trading rules journal, a place to document setups you’re studying, or simply a space to process the emotional side of trading in writing. Many experienced traders find that writing through a difficult stretch helps them return to the market with a clearer head.
Sharing Your Trading History
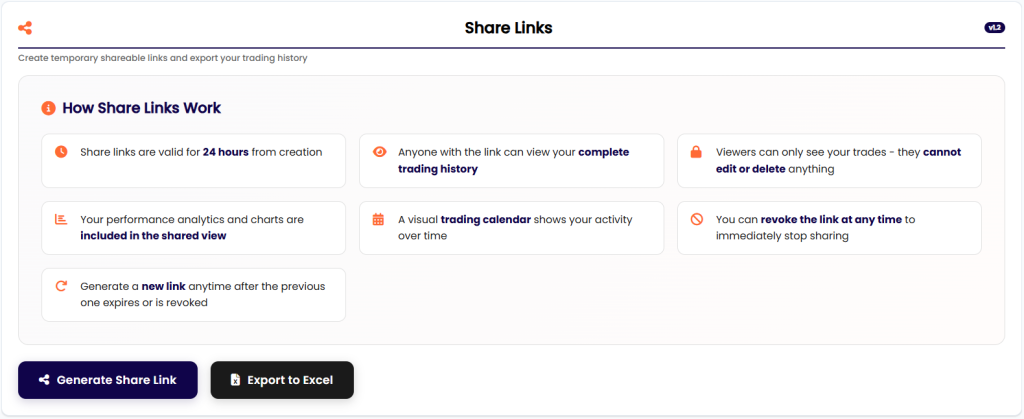
The Share Links tab lets you generate a temporary link that gives anyone read-only access to your complete trading history, performance summary, and trading calendar. The link is valid for 24 hours from the moment you generate it, and you can revoke it instantly at any time if you change your mind.
This feature is useful if you’re working with a trading mentor or coach and want to share your track record without giving them direct access to your account. It’s also useful for showing accountability to a trading group or community. The shared view includes your full trade history table, your performance summary statistics, and a visual trading calendar. Whoever receives the link can view everything but cannot edit, delete, or interact with any of your data.
The tab also shows you how many times your shared link has been viewed and when it was last accessed, so you always know who is looking at your journal. Once the 24 hours expire, the link stops working automatically.
Exporting Your Data
From the Share Links tab, you’ll also find the Export to Excel button. This downloads your complete trade history as an Excel file with all fields included date, type, pair, session, position, lot size, amount, reason, execution reason, confidence grade, and screenshot link. This is useful for running your own custom analysis, archiving your trading history, or sharing your data with a broker or prop firm as part of an evaluation process.
The journal is only as powerful as the habit you build around it. A practical structure that works for most traders is to record every trade immediately after closing it, do a brief Performance and Calendar review every weekend, check the Zella Score once a week, and run a deeper Monthly Analytics review at the end of each month.
During your weekend review, focus specifically on trades where your confidence grade was A, but the result was SL. Read what you wrote in the Reason field. Were you right about the analysis but wrong about the timing? Were there patterns in the session or the pair that you kept missing? That kind of honest self-examination, done consistently week after week, is what separates traders who genuinely improve from those who stay stuck repeating the same mistakes.
The journal does not trade for you. What it does is hold up a mirror to how you actually trade, which can be uncomfortable but is always useful. The traders who take that reflection seriously are the ones who eventually find their edge, build on it, and grow into consistent performers.
Learn more: who we are · the risk disclaimer · contact us.
Educational content, not financial advice. Leveraged trading can lose more than your deposit.