
Support and Resistance in Forex: How to Draw Zones That Hold
Published 1 November 2026. All prices and account figures below are hypothetical and exist only to show the maths. Education only, not trading advice.
You draw a line on GBP/USD, price touches it, reverses, and the level feels confirmed. Two days later price pushes 15 pips through the line, takes out your stop and then reverses anyway. Most traders have lived this. The idea of support and resistance is rarely the problem. The trouble is usually how the levels are drawn, how many of them are on the chart and what the trader does when price arrives.
What Support and Resistance Mean
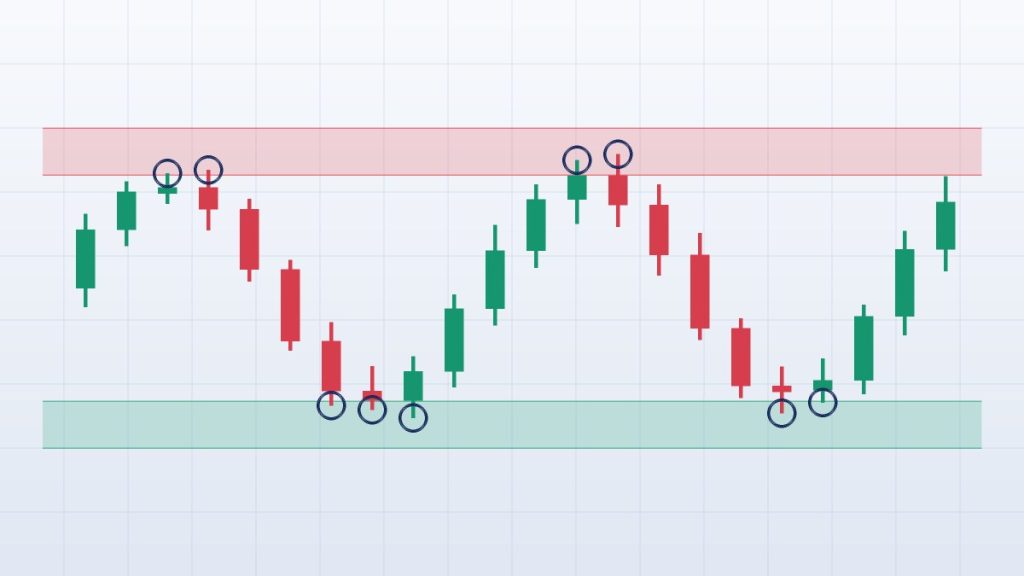
Support is an area where falling price has previously paused or turned because buying interest was strong enough to absorb the selling. Resistance is the mirror image: an area where rising price has stalled because sellers became active as it approached. BabyPips explains resistance as a supply and demand idea, with more sellers appearing the closer price gets to the level.
Traders usually offer a few reasons why these areas form:
- Traders remember previous highs and lows and place orders near them.
- Stop-loss orders tend to cluster just beyond obvious swing points.
- Round numbers such as 1.1000 or 155.00 attract attention and orders.
None of this is guaranteed. A level is a hypothesis that price may react again, not a promise.
Think in Zones, Not Lines
Price rarely turns at one exact price. Wicks overshoot, spreads widen at certain times and brokers quote slightly different prices. A zone allows for that noise. BabyPips makes a related point in its lesson on support and resistance levels: candle shadows often test a level, and a test is not the same as a break.
To draw a zone, mark the extreme of the wicks that touched the area and the cluster of candle bodies near it. The zone runs between the two. Here is a hypothetical example. On GBP/USD, price dipped to 1.3382, 1.3378 and 1.3386 on three separate days, while candles mostly closed between 1.3395 and 1.3410. A support zone from 1.3375 to 1.3410 covers the wick lows and the body cluster, with a few pips of buffer.
There is no official formula for zone width. Some traders size it as a fraction of the pair’s average true range (ATR). Whatever you choose, write it into your trading plan so you apply it consistently.
How to Mark Levels, Step by Step
- Start on a higher timeframe. Begin with the daily and 4-hour charts, where levels are usually watched by more participants than on a 5-minute chart.
- Mark clear reactions only. Choose swing highs and lows where price clearly turned, not every small wiggle.
- Look for repeat reactions. Areas where price reacted more than once, from either side, are stronger candidates.
- Draw a zone. Cover the wicks and the body cluster rather than one thin line.
- Keep three to five zones near current price. Delete old levels that price has left far behind.
- Add context. Note the trend, the session and any high-impact news due. Our guide to forex trading sessions shows when each market is active.
Types of Levels
- Horizontal swing levels from previous highs and lows. This is the most common starting point.
- Round numbers such as 1.1000 on EUR/USD or 155.00 on USD/JPY, which attract attention because they are easy to remember.
- Role reversal. When support breaks, it can become resistance on the way back up, and the reverse. BabyPips notes that when a level breaks, the follow-through depends on how strongly it had been holding.
- Dynamic levels such as trendlines and moving averages, which slope or move with price and are less precise.
Related ideas overlap with support and resistance. Fibonacci retracement levels mark possible pullback areas, and Smart Money Concepts frame similar areas as order blocks and liquidity zones.
Three Ways Traders Use Levels
- The bounce. Price reaches a zone and turns. Many traders wait for confirmation, such as a candle that closes back away from the zone, rather than placing an order blindly at the edge.
- The break and retest. Price closes beyond the zone, returns to test it from the other side and holds. Retests do not always happen, so a trader who insists on one can miss a fast move.
- No trade. When price sits mid-range between two zones, there is often no edge. Skipping the trade is a decision too.
A Worked Example (Hypothetical)
Suppose GBP/USD pulls back into the 1.3375 to 1.3410 support zone from the example above, and a daily candle closes back above the zone.
| Item | Value |
|---|---|
| Pair and prices | GBP/USD (hypothetical) |
| Support zone | 1.3375 to 1.3410 |
| Entry, after a close back above the zone | 1.3415 |
| Stop loss, below the zone | 1.3365 (50 pips) |
| Target, at the next resistance | 1.3565 (150 pips) |
| Risk-to-reward ratio | 1 : 3 |
| Account and risk per trade | $5,000 and 1% = $50 |
| Position size | 0.10 lots (about $1 per pip) |
The stop sits below the zone, not inside it. A stop inside the zone invites normal noise to take you out. The price of a wider stop is a smaller position, not a bigger risk: $50 divided by 50 pips is $1 per pip, which is 0.10 lots on a USD-quoted pair where a pip is worth about $10 per standard lot. How to Calculate Lot Size in Forex walks through the same steps.
A 1:3 ratio does not mean the trade will win. It means a win pays three times the loss, and whether that is enough depends on how often you win. Our guide to the risk-to-reward ratio and expectancy explains the maths.
When Levels Fail: News and Event Risk
High-impact releases can blow through any level. Spreads widen, orders can fill at worse prices and price can gap past a stop. This week alone brings the RBA decision, the Bank of England decision and the US jobs report discussed in our gold and NFP analysis. Many traders reduce size or stand aside until the first reaction settles. Check the Forex Economic Calendar before you trade a level.
Common Mistakes
- Too many lines. A chart covered in levels gives an excuse for any trade.
- Treating a level as an exact price and ignoring wicks.
- Trading 1-minute levels without checking the daily chart.
- Placing the stop inside the zone, or having no stop at all.
- Redrawing levels after the move, which flatters the past through hindsight.
- Insisting a level has to hold. Levels fail often. A planned stop is how you handle that.
- Revenge trading after a stop-out at a level. Read Revenge Trading in Forex if that sounds familiar.
How to Practise
Screenshot every trade you take at a level and record the zone, timeframe, trigger and result in a journal. After 30 trades, review which zones, sessions and setups worked. The Hamro Trading Journal is built for this, and Why Should Traders Keep a Trading Journal? explains the benefits. Then put your rules in writing with our forex trading plan template. Practise on a demo account first.
Key Takeaways
- Support and resistance are areas of past reaction, not guarantees.
- Draw zones that cover wicks and body clusters rather than single lines.
- Start on higher timeframes and keep three to five zones near price.
- Put the stop beyond the zone and size the position to fit it.
- Expect levels to fail around high-impact news, and plan for it.
This article is for education only and is not investment advice. Trading leveraged products carries a high risk of loss, and you can lose more than you expect. Rules on forex trading differ between countries, so read Is Forex Trading Legal in Nepal? before you trade.
Sources
- BabyPips: Support and Resistance
- BabyPips: Support and Resistance Levels
- BabyPips Forexpedia: Resistance
Learn more: who we are · the risk disclaimer · contact us.
Educational content, not financial advice. Leveraged trading can lose more than your deposit.